Connecting To Grafana With Terraform
Table of Contents
You ever realize that you've been taking the long route and there were shorter options? Me, too. Working at Harness exposed me to A LOT of practices that I'd never seen before. One of those practices was automating the creation of your infrastructure with code. This is better known as Infrastructure as Code.
For someone that builds and deploys alot to many different services, this expedites the process of getting things setup. To give you a quick idea of what working with Terraform is like, I decided to create an AWS Dashboard in Grafana.
To get started, I followed the Terraform Docs for getting setup.
You'll need to first ensure you have Terraform installed on your system. We all have different flavors that we like to indulge in, so i'll just provide a link that includes the available options.
Once you've successfully installed Terraform, you're ready to start with the code.
Setting Up Grafana
The next step in this process is creating a connection within Grafana. The walkthrough is fairly seamless.
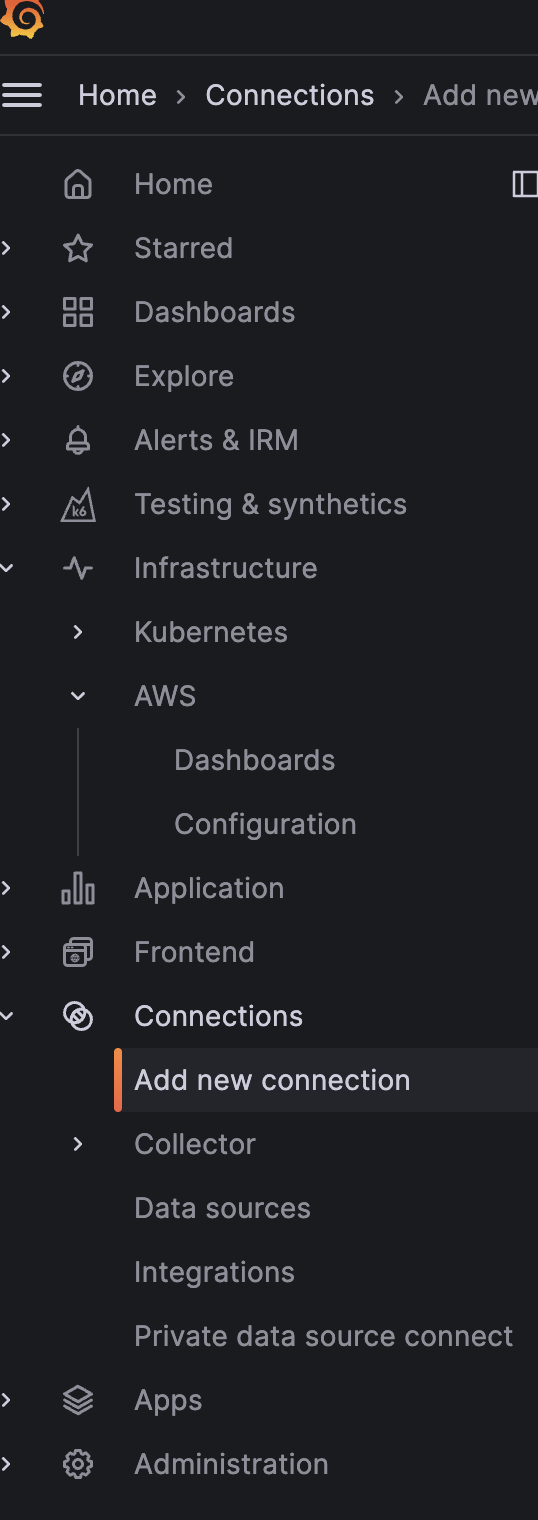
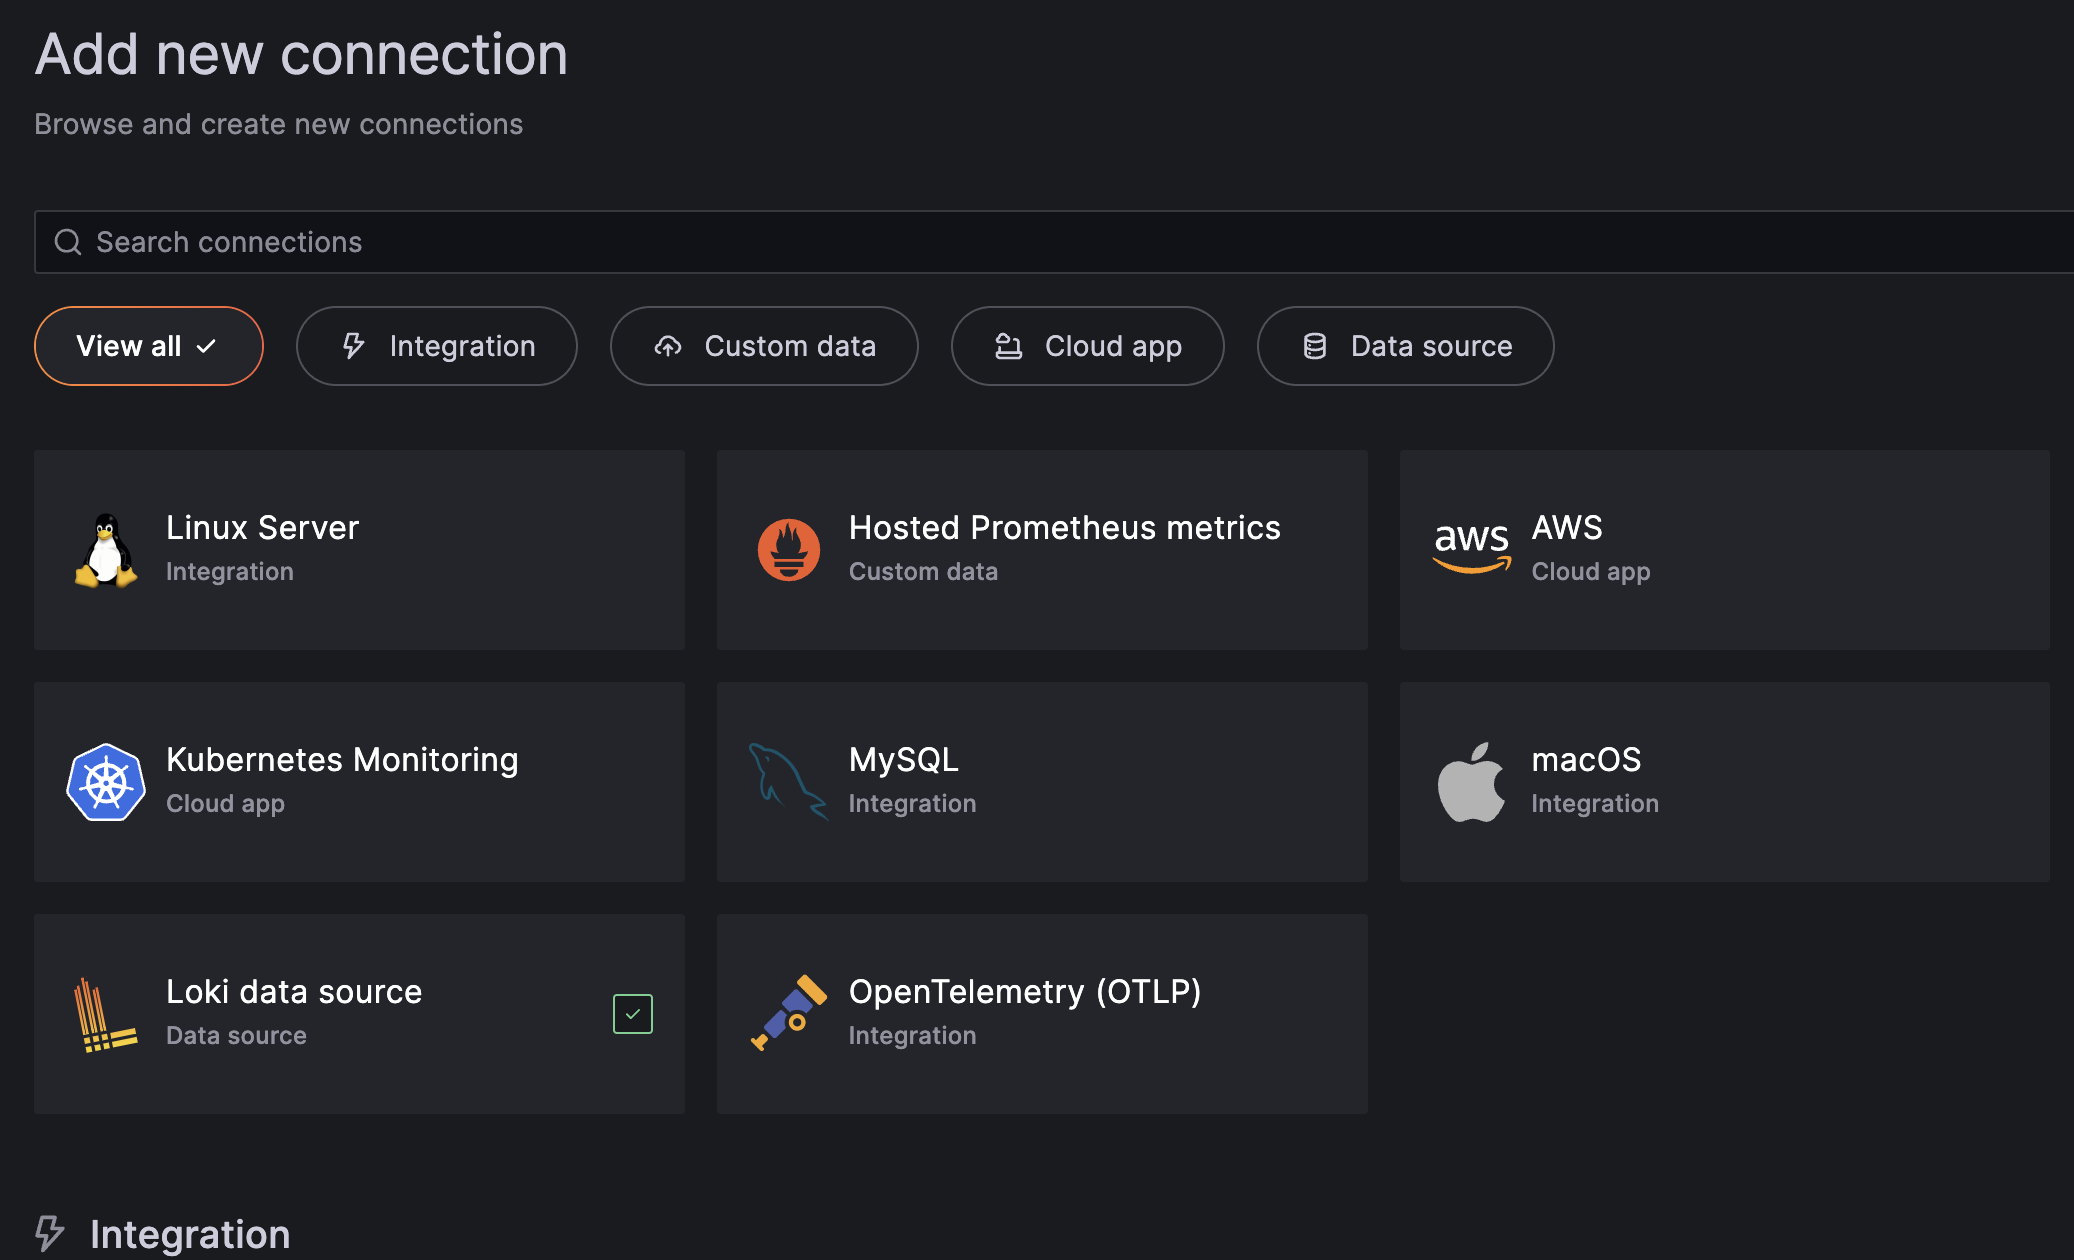
Find the link titled "Connections" and select "Add A New Connection". Grafana has a ton of options in terms of what tools you'll be able to connect to. We're only working with AWS in this instance. It should be immediately visible, but if not, just simply search for "AWS".
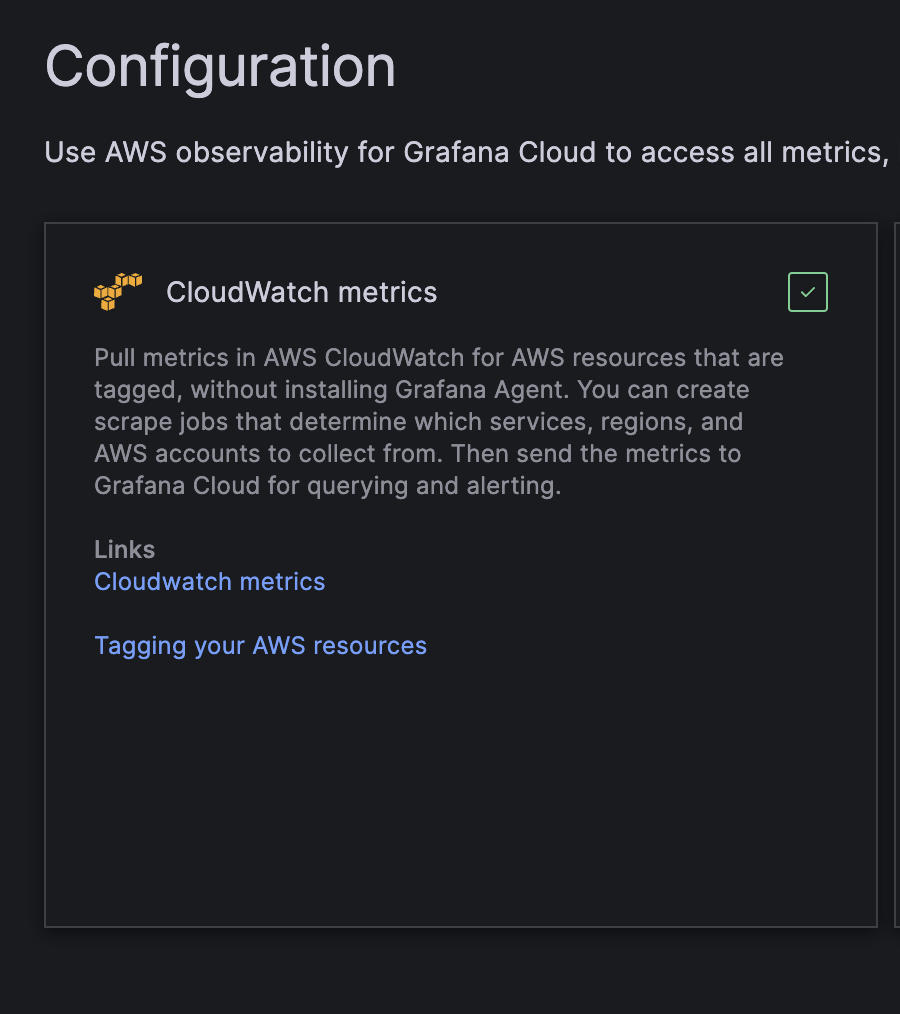
If done right, you should be at the screen that allows you to choose which AWS metrics you're looking to add to Grafana. I was interested in pulling in the data from Cloudwatch, which will be the first selection.
At this point, you should be able to add a new scrape job. Sidenote: Scrape Jobs are the actions taken from Grafana to pull the data in, don't get stumped by the Jargon.
Using Terraform to Create A Role For Grafana
We've finally made our way back to the code. The entire purpose of this code is automating the process of
1) Generating a New Role for Grafana To Have Access To The Cloudwatch Metrics
Okay, let's walk through each {configuration block}.
terraform {
  required_providers {
    aws = {
      source  = "hashicorp/aws"
      version = "5.46.0"
    }
  }
}
The first block is how you choose the provider(plugin) that you want to use for the configuration. We're going with AWS and version 5.46.0 since I'm looking to connect the AWS Cloudwatch metrics.
locals {
  aws_account_id = "******"
}
The locals block is where you define local variables that can be reused within your terraform configuration. I'm only using my aws_account_id here.
Sidenote: Always ensure you're following the proper security protocols. Never directly enter your credential into your code. Look in .env file, secret managers, and other sources of hiding credentials
Next, I created a data block. This is the meat and potatoes of my terraform configuration.
data "aws_iam_policy_document" "trust_grafana" {
  statement {
    effect = "Allow"
    principals {
      type        = "AWS"
      identifiers = ["arn:aws:iam::${local.aws_account_id}:root"]
    }
    actions = ["sts:AssumeRole"]
    condition {
      test     = "StringEquals"
      variable = "sts:ExternalId"
      values   = [var.external_id]
    }
  }
}
In a nutshell, the data block includes setup of the permissions and security associate with new role.
Once the permission have been set, we can now set up the role and attached a policy to it within the resource blog and attach a policy to it.
resource "aws_iam_role" "grafana_labs_cloudwatch_integration" {
  name        = var.iam_role_name
  description = "Role used by Grafana CloudWatch integration."
  # Allow Grafana Labs' AWS account to assume this role.
  assume_role_policy = data.aws_iam_policy_document.trust_grafana.json

  # This policy allows the role to discover metrics via tags and export them.
  inline_policy {
    name = var.iam_role_name
    policy = jsonencode({
      Version = "2012-10-17"
      Statement = [
        {
          Effect = "Allow"
          Action = [
            "tag:GetResources",
            "cloudwatch:GetMetricData",
            "cloudwatch:ListMetrics",
            "apigateway:GET",
            "aps:ListWorkspaces",
            "autoscaling:DescribeAutoScalingGroups",
            "dms:DescribeReplicationInstances",
            "dms:DescribeReplicationTasks",
            "ec2:DescribeTransitGatewayAttachments",
            "ec2:DescribeSpotFleetRequests",
            "shield:ListProtections",
            "storagegateway:ListGateways",
            "storagegateway:ListTagsForResource"
          ]
          Resource = "*"
        }
      ]
    })
  }
}
In the final block, the output block, I define a variable that I'd like printed to the console. That variable is key because Grafana will need this information to complete the setup.
output "role_arn" {
  value       = aws_iam_role.grafana_labs_cloudwatch_integration.arn
  description = "The ARN for the role created, copy this into Grafana Cloud installation."
}
If you've made it to this point and are following along, you have created your first terraform code.
All that remains is creation of the role. This is done using the following terraform commands.
Note: You'll need to install the aws cli as well as terraform before you run these commands
terraform init - Init your terraform code
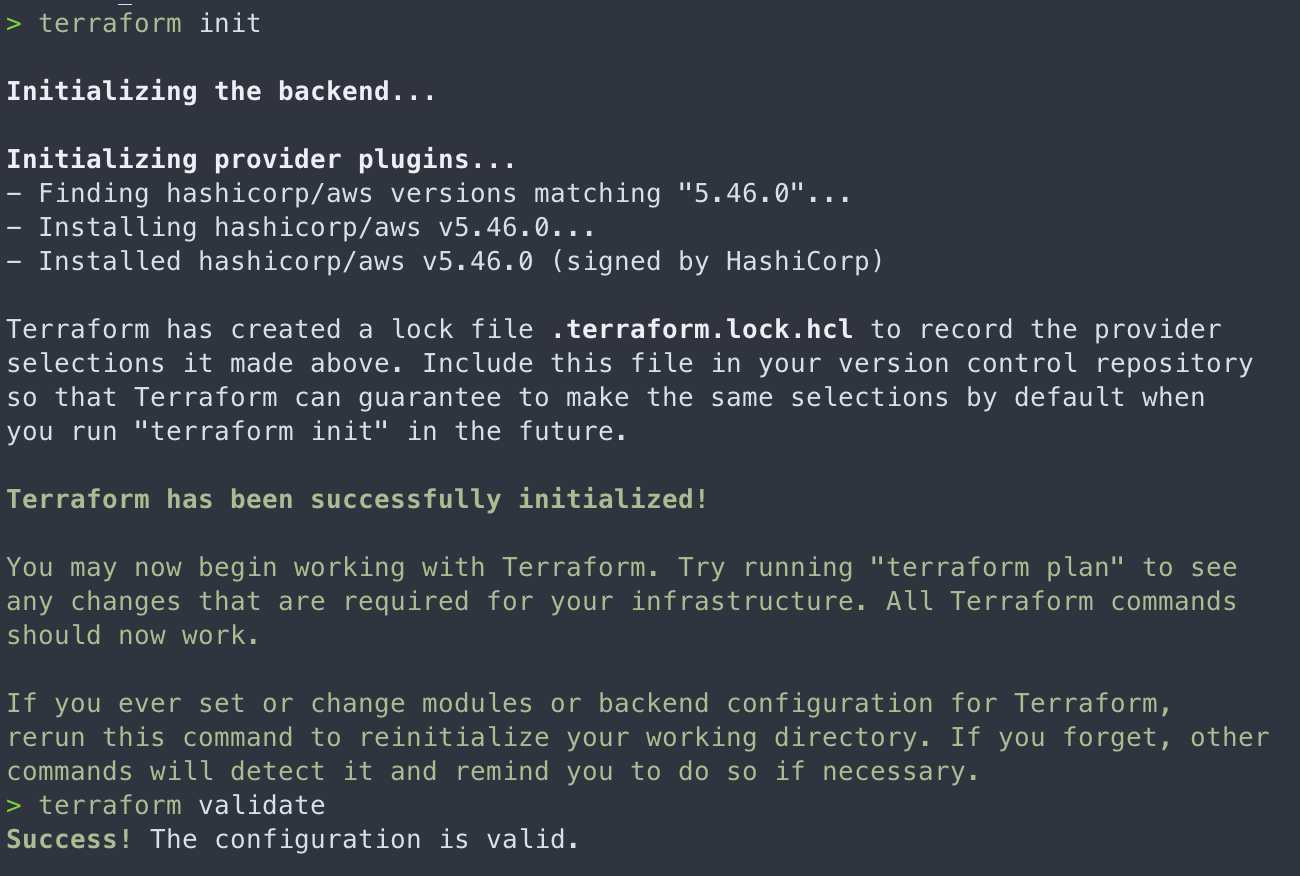
terraform plan - Generate the terraform plan

terraform apply - Apply the terraform that you planned
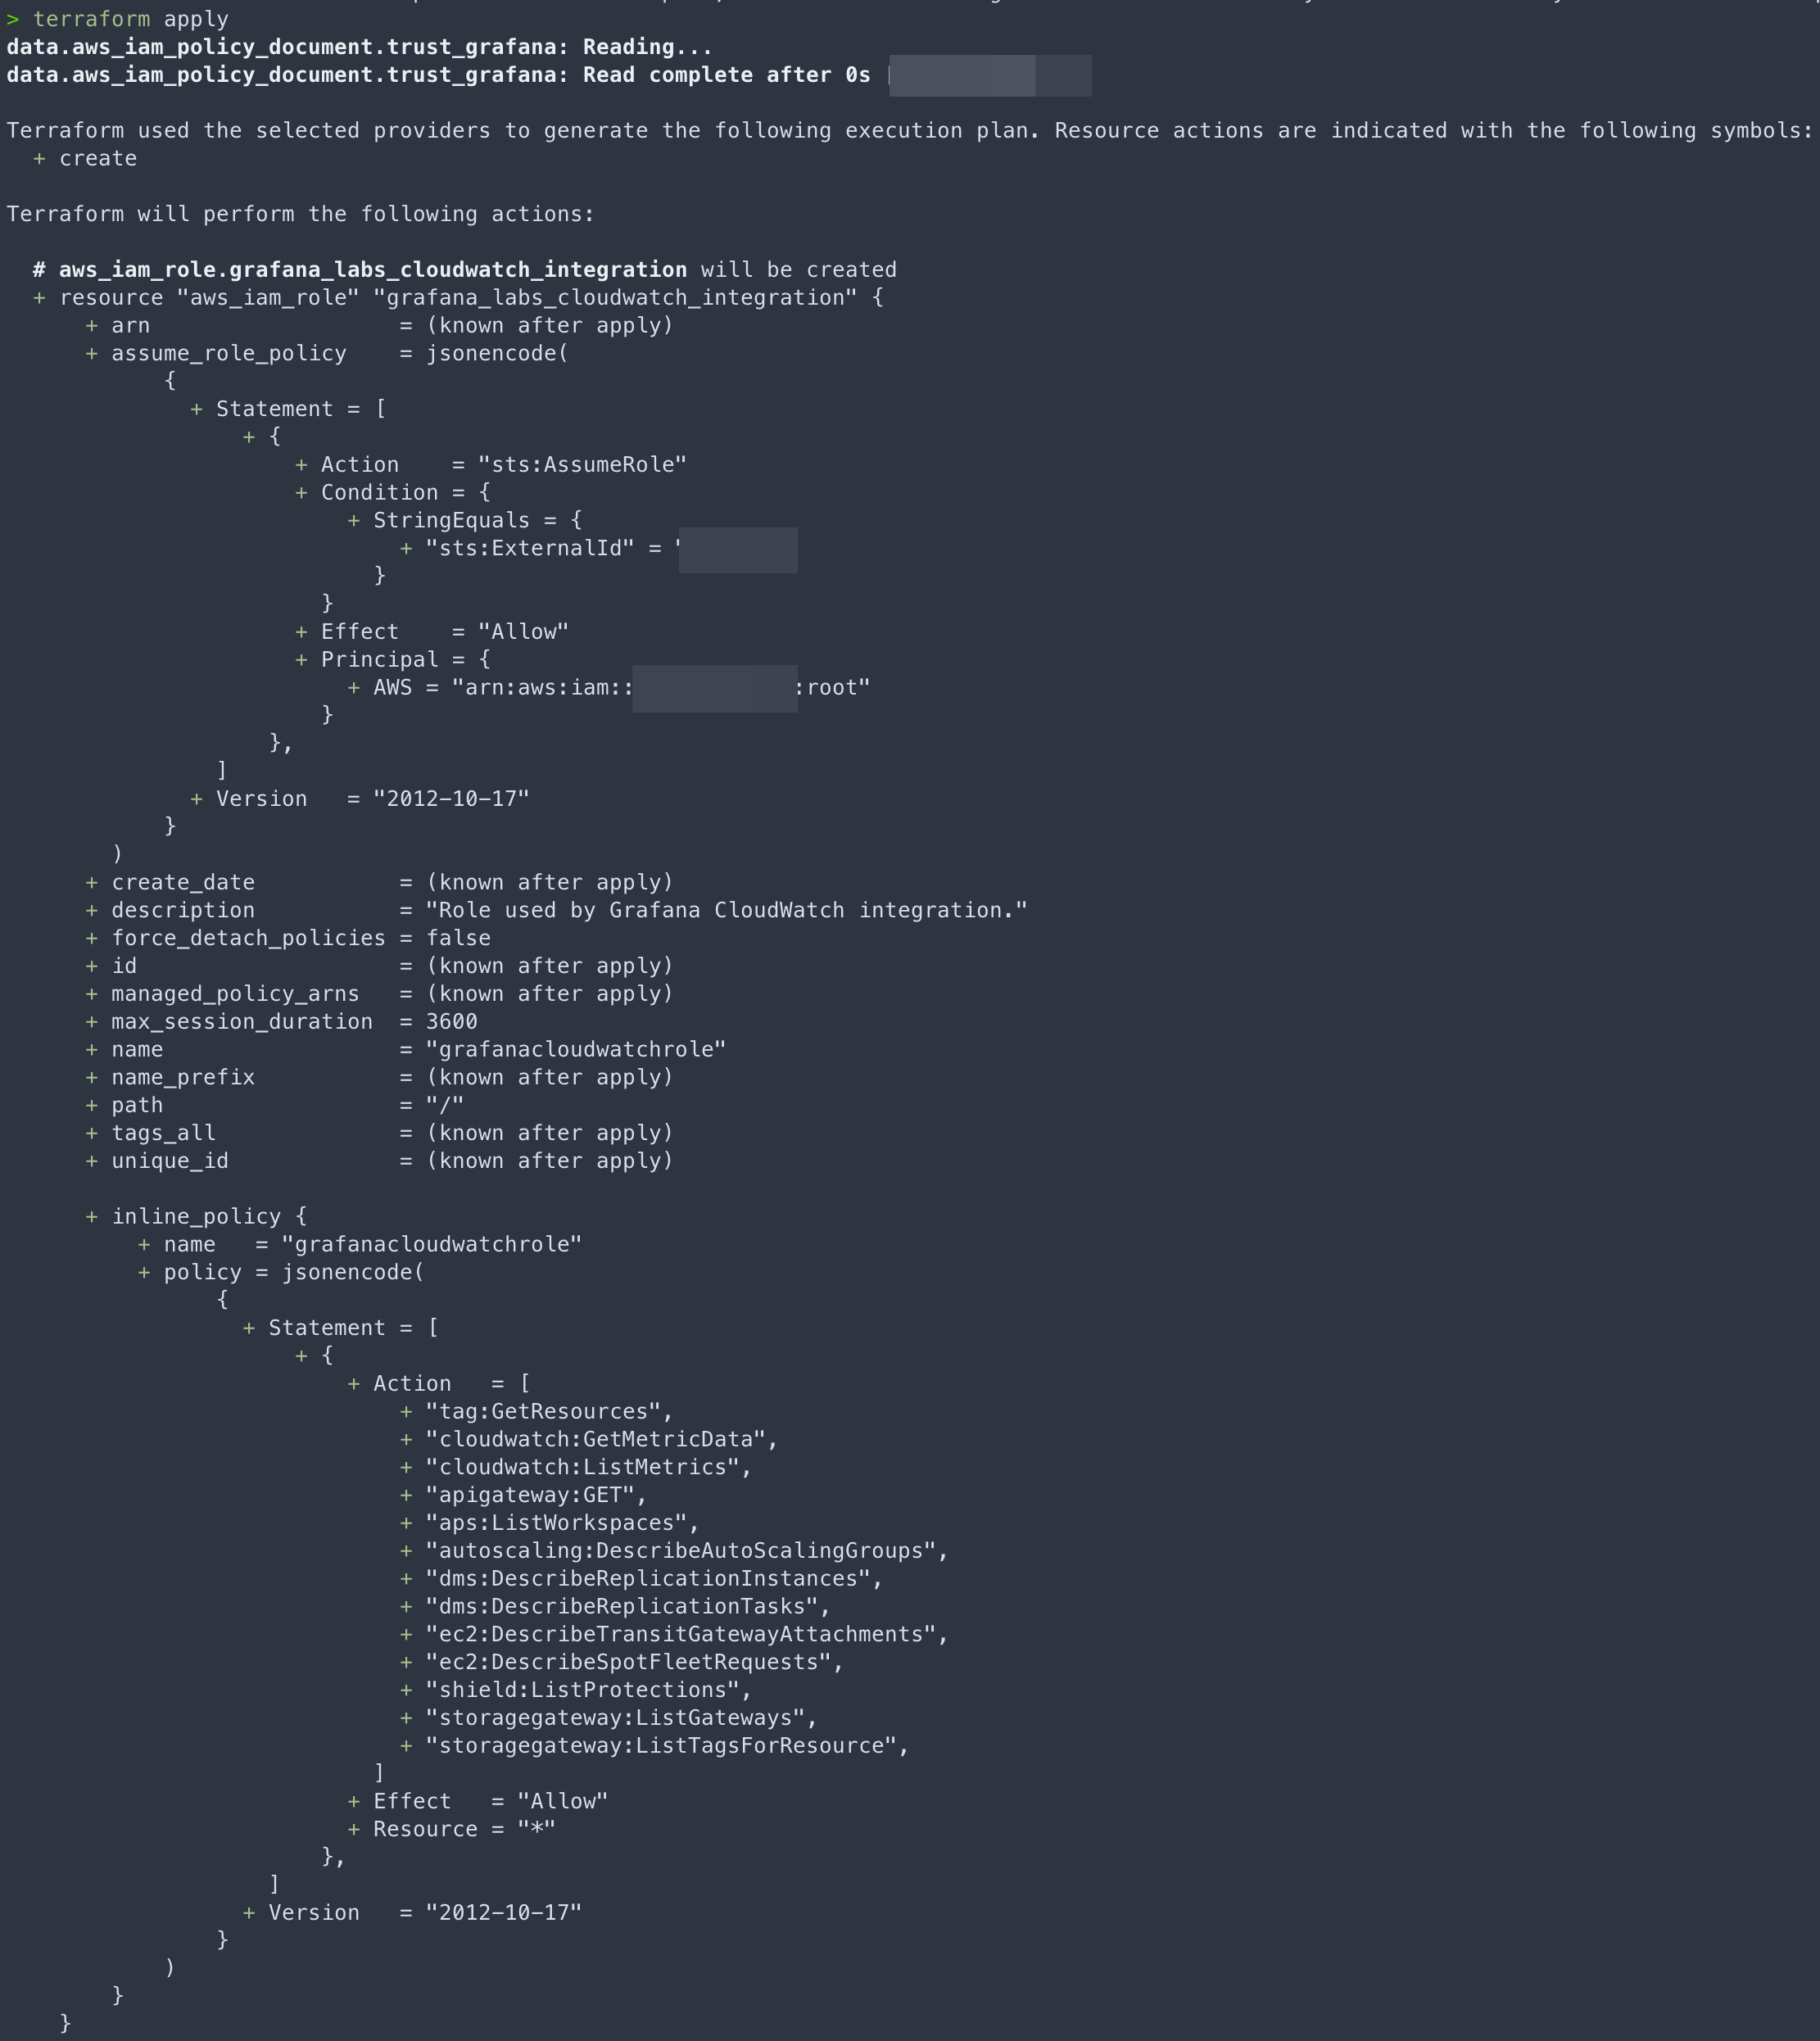
If successful, you'll have a new role created and will be able to finish your connection in Grafana.
It may take some time for the metrics to be seen within your dashboards, so give it a few hours.